
Adana: Bellingcat hackathon project for OSINT researchers
Briefly about my new OSINT project developed during the first in-person Bellingcat hackathon: adana.soxoj.com

Last week I participated in the first Bellingcat’s First In-person Hackathon in Amsterdam as a part of the Watch Cats team. Unfortunately, we didn’t win any Bellingcat Hackathon nominations. But I'm not giving up and I am going to continue to develop the project. Is it worth it? Take a look; like and share if you think it is!
TL;DR: 1-click analytical dashboard for OSINT researchers
You can test it here: https://adana.soxoj.com

The problem we detected: there is a lack of easy-to-use (and install) analysis tools for social media posts. So, we implemented a cloud-friendly one providing quick high-level analysis results about sentiments and topics of narratives.
Of course, the process of gathering posts is not so easy, but we decided to focus specifically on analysis functions. However, we've supported in tool Zeeschuimer export format (free browser extension), and Maltego CSV export, and wrote instructions on how to prepare datasets with these tools.
Moreover, we prepared some test datasets of posts related to wars, climate change, COVID... Check the GDrive folder if you are interested.
Development process. Initially, we made some simple statistics dashboards for hashtag analysis and so on, but the topic we chose - analysis narratives to identify disinformation campaigns and analyze opinions - required a more in-depth approach.

After gathering some hypotheses about useful features and some polls of hackathon participants, we decided to extract sentiments and topics. Thanks to my teammate, we efficiently dug into ML and tried several approaches to clusterization and classification of posts.
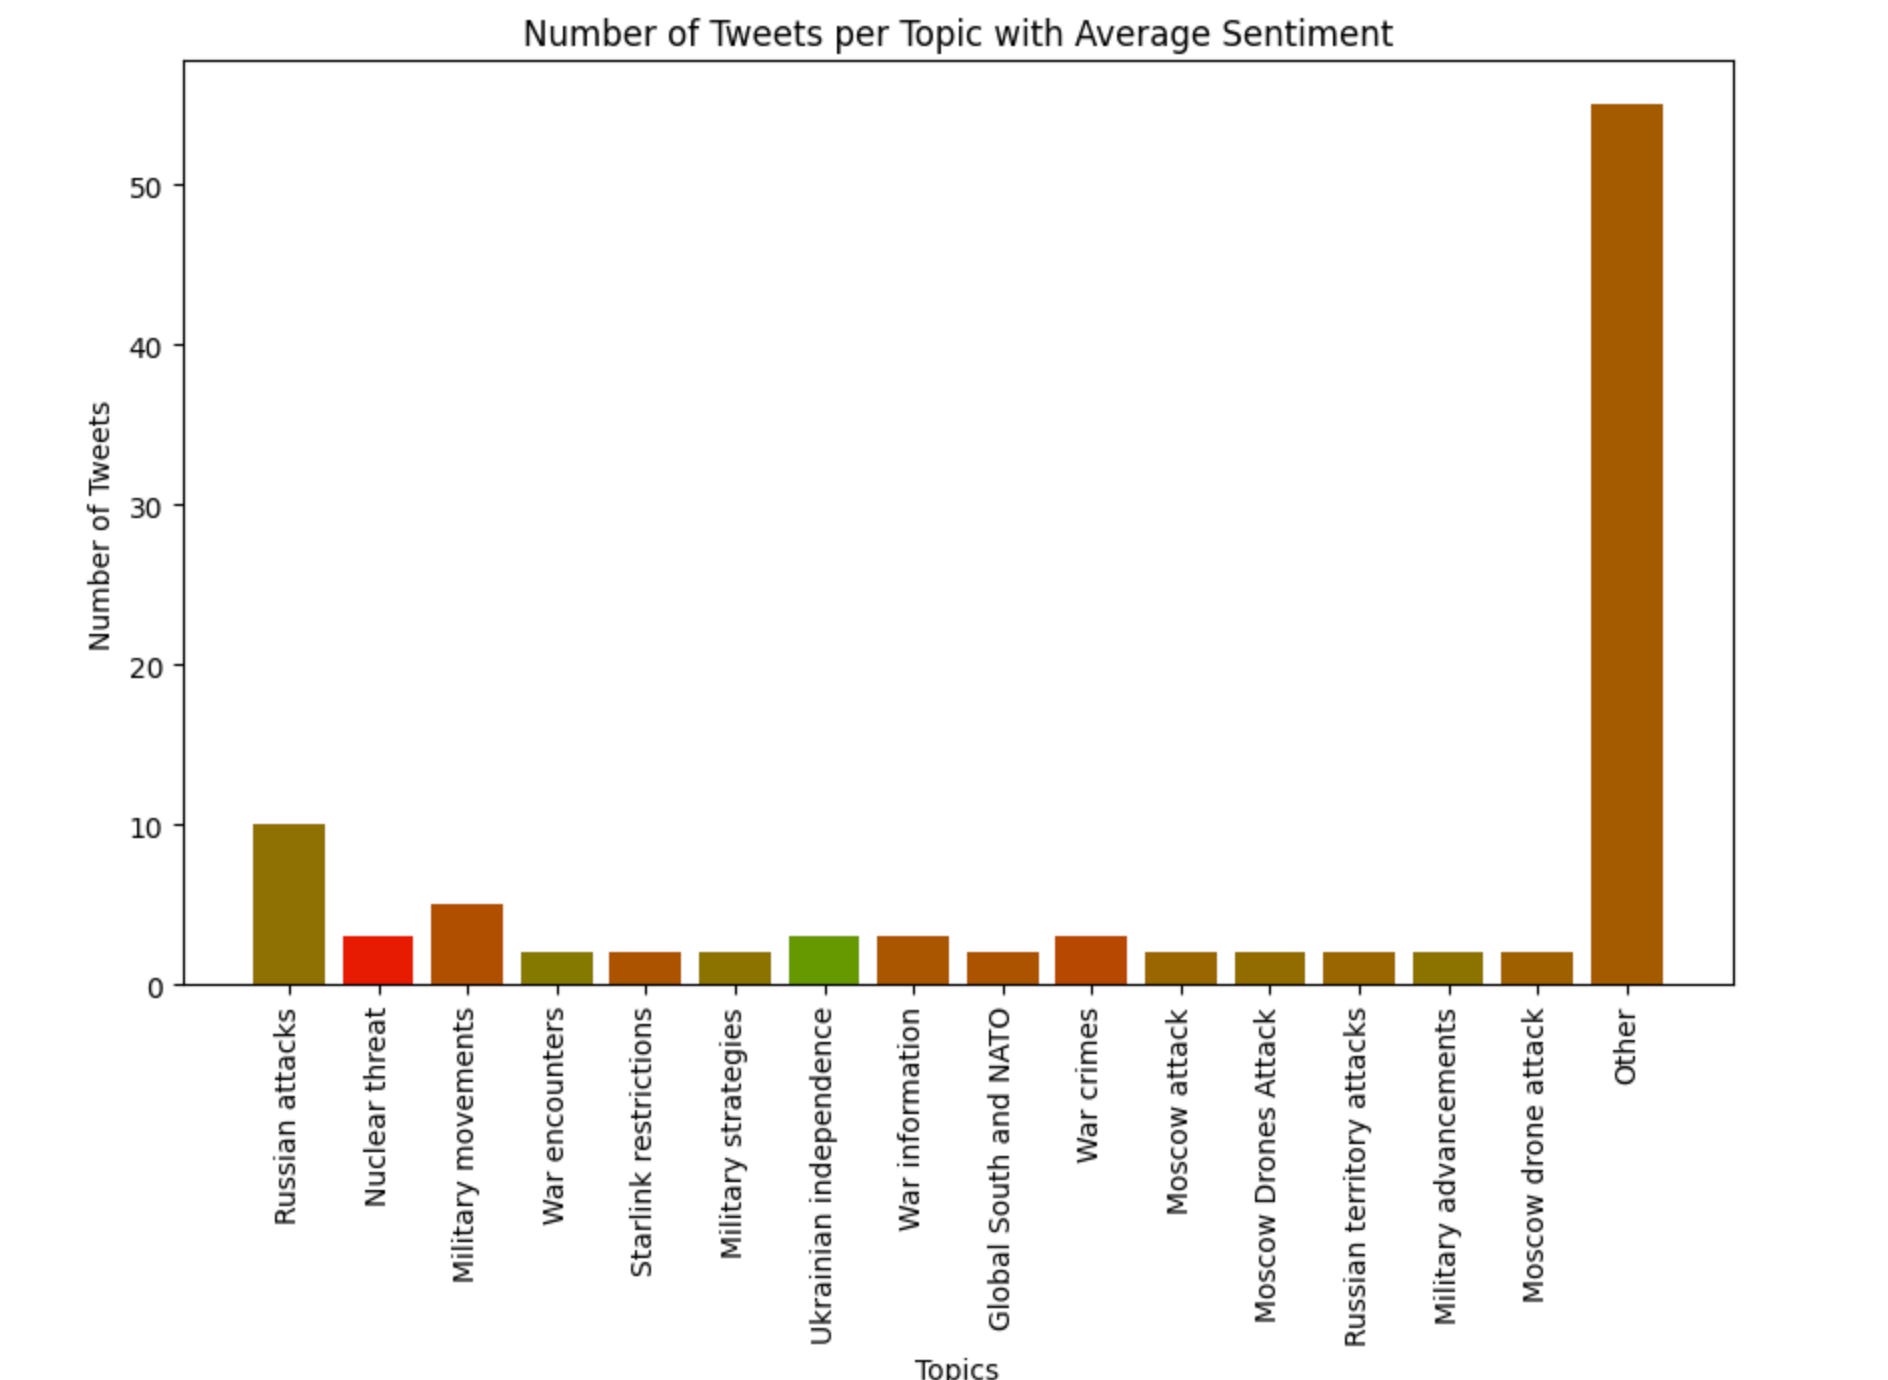
To clusterize tweets by topics we used the hkunlp/instructor-large model to cluster tweets by topics to calculate embeddings for each tweet. Subsequently, we employed the Mini-Batch K-Means clustering algorithm to group these tweets into distinct clusters.
From each cluster, we then selected the 10 most representative tweets, identified as those closest to the cluster's centroid. Finally, we leveraged the capabilities of GPT-4 Turbo to generate human-readable topics based on these representative tweets.
So, we've written Jupyter Notebooks, labelled some of the test datasets and uploaded them to the demo project page to allow testing it in 1 click. The final Jupyter Notebook featuring a versatile clustering algorithm can be found here.
We've used Streamlit for rapid prototyping and data visualization, and its data analytics approach seemed very suitable for us. Of course, we are thinking of a user-friendly UI for clustering and will try to focus on enhancing the method for determining the optimal number of clusters.
And, yeah, of course, the project was already published in GitHub repo under an MIT license.
So, what do you think about the project? Does it make sense to develop it further? Will you personally use it and for what purposes?
Please, leave your feedback as we need to determine whether it’s worth developing this project!